
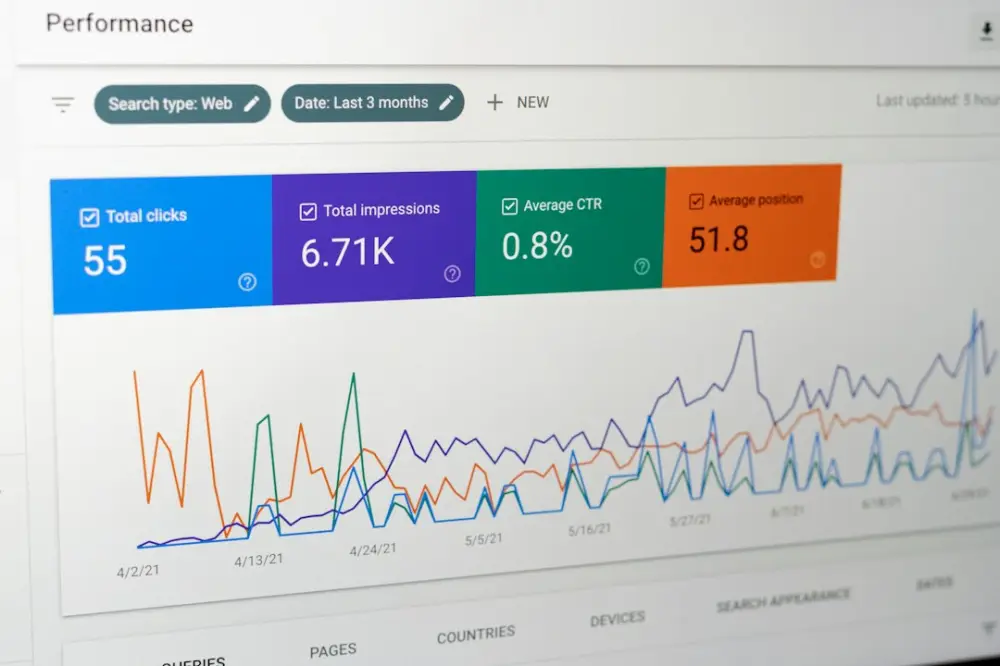
Combining qualitative and quantitative evidence is the process of merging statistical scale with descriptive context to form a complete research picture. While quantitative data tracks measurable trends and frequencies, qualitative insights uncover the underlying motivations and human behaviors driving those numbers. This integration allows researchers to move beyond surface-level metrics to understand the specific "why" behind any observed shift.
Relying on a single data source often creates a tension between broad trends and individual realities. A statistical drop in engagement identifies a problem, but it cannot fix it without the nuance of human feedback. By using mixed methods, teams can resolve contradictions in their data and ensure that decisions are grounded in both objective facts and the lived experiences of their audience.
The Basics of Combining Qual and Quant Evidence
The integration of evidence typically begins with understanding the specific roles each data type plays. Quantitative evidence is the language of scale. It uses tools like structured surveys, A/B testing platforms, and web analytics to gather data that can be counted and statistically analyzed. For example, a transit agency might use automated passenger counters to determine that ridership on a specific bus route has declined by 15% over six months. This is a clear, objective fact, but it is also a silent one. It does not explain if the decline is due to poor reliability, a change in local employment, or a perceived lack of safety.
Qualitative evidence provides the voice for those numbers. Through semi-structured interviews, focus groups, or ethnographic observation, researchers capture the context. In the transit example, conducting ten in-depth interviews with former riders might reveal that a new construction project two miles away has made the bus stop inaccessible for those with mobility aids. When these two pieces of evidence are combined, the researcher moves from a vague problem (declining ridership) to a specific, actionable solution (improving stop accessibility during construction).
This process is often called triangulation. By looking at the same problem through different lenses, you increase the validity of your conclusions. If the data says users are leaving a website and the interviews say the checkout process is confusing, the two points of evidence "triangulate" on a single truth. This convergence reduces the risk of making a decision based on a statistical outlier or a biased anecdotal account.
When to Choose Mixed Methods Over Singular Approaches
There are specific scenarios where a singular approach—either purely quantitative or purely qualitative—will inevitably fail to provide the necessary clarity. One such scenario is during the evaluation of a new product or policy where the stakes are high and the user behavior is unpredictable. If you only look at the numbers, you might see a high adoption rate and assume success. However, without qualitative feedback, you might miss the fact that users are only adopting the tool because they have been forced to by a manager, and they are experiencing high levels of frustration that will eventually lead to burnout or churn.
Another critical time for mixed methods is when the quantitative data presents a paradox. Imagine a scenario where a non-profit sees an increase in donations but a decrease in volunteer hours. On paper, the organization looks financially healthier, but the drop in engagement suggests a weakening of the community bond. Here, qualitative inquiry is the only way to resolve the contradiction. Researchers might discover that a recent digital-only marketing campaign successfully reached new donors but alienated the local volunteer base who felt the organization was becoming too corporate. We are seeing how ai is finally helping us find these subtle shifts in sentiment by processing large volumes of text data that were previously too labor-intensive to analyze alongside traditional metrics.
Mixed methods are also essential when exploring sensitive social issues. In public health research, for instance, a study might track the number of people attending a local clinic (quant). If attendance is low, the numbers alone might suggest a lack of need. However, qualitative interviews might reveal that the clinic’s hours conflict with local work shifts or that there is a cultural stigma associated with the facility. In these cases, the qualitative data doesn't just supplement the quantitative data; it corrects it.
Designing Effective Mixed-Method Experiments
Effective research design requires intentionality in how the two types of data interact. There are three primary structures for these experiments: explanatory, exploratory, and concurrent designs. An explanatory sequential design starts with quantitative data collection. Once the patterns are identified, the researcher uses qualitative methods to explain the outliers or the general trends. For example, a software company might analyze user logs to find the exact point where users drop off in a sign-up flow and then conduct usability testing to watch people struggle with that specific screen.
An exploratory sequential design works in reverse. It begins with qualitative research to understand a new phenomenon and then uses those insights to build a quantitative instrument, like a survey. This is common when entering a new market where the variables aren't yet known. You might interview ten local business owners to understand their challenges and then use their specific phrasing and concerns to create a nationwide survey that reaches thousands. This ensures the survey is actually asking the right questions.
Finally, a concurrent design collects both types of data simultaneously. This is often seen in large-scale evaluations where a survey includes both multiple-choice questions and open-ended text boxes. The key to success here is ensuring that the qualitative data is not treated as an afterthought. It requires a rigorous coding process where text responses are categorized and compared against the numerical scores. Using turning data into actionable clarity for stakeholders involves presenting these integrated findings in a way that shows how the "what" and the "why" support the same strategic goal.
Expert Perspectives: Markus Goldstein and Development Impact
In the field of international development, the push for mixed methods has been championed by researchers like Markus Goldstein at the World Bank. His work within the Development Impact Evaluation (DIME) group often highlights the limitations of relying solely on Randomized Controlled Trials (RCTs). While an RCT can tell you with scientific certainty if a specific intervention—like providing free textbooks—increased test scores, it often fails to explain why the intervention worked in one village but failed in another.
Goldstein and his colleagues emphasize that "process evaluations," which are largely qualitative, are necessary to understand the implementation of a project. In one instance involving agricultural interventions in Africa, quantitative data showed that female farmers were not adopting a new type of high-yield seed at the same rate as male farmers. The initial assumption might have been a lack of information. However, qualitative fieldwork revealed that the seeds required more water, and since women were responsible for water collection and already over-burdened, the "better" seed was actually a net negative for their daily lives. This insight, which redirected the entire program, would have been invisible in a standard statistical model.
This perspective shifts the focus from "did it work?" to "under what conditions does it work, and for whom?" By incorporating qualitative field notes into the rigorous framework of development economics, researchers can avoid the trap of universal solutions that fail to account for local social dynamics. This approach is a hallmark of high-level decision intelligence, where the goal is not just to find a statistically significant result, but to find a sustainable, human-centric outcome.
Put mixed methods into practice
Begin with a narrow research question so qual and quant pieces stay aligned.
- First step: write one sentence on what qualitative insight must explain.
- Start by choosing one quantitative indicator you can measure reliably.
- To begin fieldwork, pilot interviews alongside a short survey on the same topic.
- Follow these steps to compare themes and numbers before scaling sample size.
- Share preliminary tables and quotes with stakeholders early for feedback.
Join the Conversation: Authors and Research Updates
The transition from raw data to informed action is rarely a straight line. It requires a willingness to look past the spreadsheet and engage with the messy, often contradictory stories that users and citizens tell. For those tasked with leading organizations or designing public policy, the ability to synthesize these different forms of evidence is a vital skill. It prevents the "hollow" feeling that comes from making decisions based on numbers that lack a human pulse.
As research methodologies continue to evolve, the integration of qualitative and quantitative evidence will likely become the standard rather than the exception. The most effective leaders are those who can sit comfortably between these two worlds—understanding the statistical significance of a trend while also empathizing with the individual experience that created it. This balance is what allows for true clarity in a world that is often overwhelmed by noise.
At Elucd, we believe that the most powerful insights are found at the intersection of data and human experience. By combining the precision of quantitative metrics with the depth of qualitative inquiry, we help leaders move beyond simple observations toward meaningful impact. Whether you are navigating a shift in market sentiment or evaluating the success of a community program, staying grounded in a mixed-methods approach ensures that your decisions are both evidence-based and human-centered. We invite you to explore our latest research updates and join the conversation as we continue to refine the tools of modern decision intelligence.